
The Seven Management and Planning Tools
The Seven Management and Planning Tools have their roots in Operations Research work done after World War II and the Japanese Total Quality Control (TQC) research. In 1979 the book Seven New Quality Tools for Managers and Staff was published and in 1983 was translated into English.
The seven tools include:
- Affinity Diagram (KJ Method)
- Interrelationship Diagraph (ID)
- Tree Diagram
- Prioritization Matrix
- Matrix Diagram
- Process Decision Program Chart (PDPC)
- Activity Network Diagram
This tool takes large amounts of disorganized data and information and enables one to organize it into groupings based on natural relationships. It was created in the 1960s by Japanese anthropologist Jiro Kawakita.
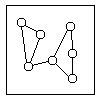
2-Interrelationship Diagram
3-Tree Diagram

This tool is used to break down broad categories into finer and finer levels of detail. It can map levels of details of tasks that are required to accomplish a goal or task. It can be used to break down broad general subjects into finer and finer levels of detail. Developing the tree diagram helps one move their thinking from generalities to specifics.
4-Prioritization Matrix

This tool shows the relationship between items. At each intersection a relationship is either absent or present. It then gives information about the relationship, such as its strength, the roles played by various individuals or measurements. Six differently shaped matrices are possible: L, T, Y, X, C, R and roof-shaped, depending on how many groups must be compared.
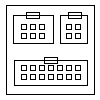
5-Matrix Diagram
6-Process Decision Program Chart (PDPC)

7-Activity Network Diagram
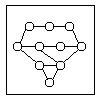
This tool is used to plan the appropriate sequence or schedule for a set of tasks and related subtasks. It is used when subtasks must occur in parallel. The diagram enables one to determine the critical path (longest sequence of tasks). (See also PERT diagram.)


Thank you for sharing about resource management tool. The way you shared the information. It's gonna be really helpful.
ReplyDelete